
⇧ アメリカ発の企業が突出してますな...
Javaの「heap dump」ファイルとは?
Oracleさんの公開している情報によると、
A heap dump is a snapshot of all the objects in the Java Virtual Machine (JVM) heap at a certain point in time. The JVM software allocates memory for objects from the heap for all class instances and arrays. The garbage collector reclaims the heap memory when an object is no longer needed and there are no references to the object. By examining the heap you can locate where objects are created and find the references to those objects in the source. If the JVM software is failing to remove unneeded objects from the heap, Java VisualVM can help you locate the nearest garbage collecting root for the object.
https://docs.oracle.com/javase/8/docs/technotes/guides/visualvm/heapdump.html
⇧ とのこと。
「heap」については、
⇧ 前回の記事にあるように、「Java 仮想マシン(JVM:Java Virtual Machine)」で使用しているメモリの構成の一部ですと。
You can use Java VisualVM to browse the contents of a heap dump file and quickly see the allocated objects in the heap. Heap dumps are displayed in the heap dump sub-tab in the main window. You can open binary format heap dump files (.hprof) saved on your local system or use Java VisualVM to take heap dumps of running applications.
https://docs.oracle.com/javase/8/docs/technotes/guides/visualvm/heapdump.html
⇧「heap dump」ファイルの拡張子は「.hprof」ですと。
Javaの「heap dump」ファイルを出力してみる
「heap dump」ファイルを取得する方法としては、
⇧ 様々あるようなのだけど、今回は、「OOME(OutOfMemoryError)」が起きた時の「Java 仮想マシン(JVM:Java Virtual Machine)」でのメモリーの使用状況を把握したいので、
-XX:HeapDumpOnOutOfMemoryErrorオプション
このオプションは、JavaヒープまたはPermanent世代からの割当てが満たされない場合に、Java HotSpot VMにヒープ・ダンプを生成するよう指示します。このオプションを使って実行するときのオーバーヘッドはないため、OutOfMemoryError例外が表面化するまでに長い時間のかかる本番システムに役立つ可能性があります。
https://docs.oracle.com/javase/jp/8/docs/technotes/guides/troubleshoot/clopts001.html
⇧ 上記の「Java 仮想マシン(JVM:Java Virtual Machine)」の起動時のオプションを指定して「heap dump」ファイルを取得していこうと思います。
Eclipseを起動して、適当に「Javaプロジェクト」を作成して、mainメソッドのある「.java」ファイルを用意しておきます。

⇧ 上記サイト様を参考に、「OOME(OutOfMemoryError)」を意図的に発生させるコーディングを行う。
import java.security.NoSuchAlgorithmException;
import java.util.ArrayList;
import java.util.List;

public class TestHeap {

	public static void main(String[] args) throws NoSuchAlgorithmException {
		// TODO 自動生成されたメソッド・スタブ
//		List<String> memoryTestList = new ArrayList<>();
//		BigInteger count = BigInteger.ONE;
//		StringBuilder sb = new StringBuilder();
		List<byte[]> memoryTestList = new ArrayList<>();

		while (true) {
//			byte bytes[] = new byte[1024];
//			SecureRandom secRandom = SecureRandom.getInstance("SHA1PRNG");
//			secRandom.nextBytes(bytes);
//
//			StringBuffer buf = new StringBuffer();
//			for (int i = 0; i < bytes.length; i++) {
//			    buf.append(String.format("%02x", bytes[i]));
//			}
//
//			sb.append(count)
//			  .append(": ")
//			  .append(buf.toString());
//			memoryTestList.add(sb.toString());
//			System.out.println(sb.toString());
//			sb.setLength(0);
//			count = count.add(BigInteger.ONE);

			final byte[] bytes = new byte[1048576];
			memoryTestList.add(bytes);

		}

	}

}
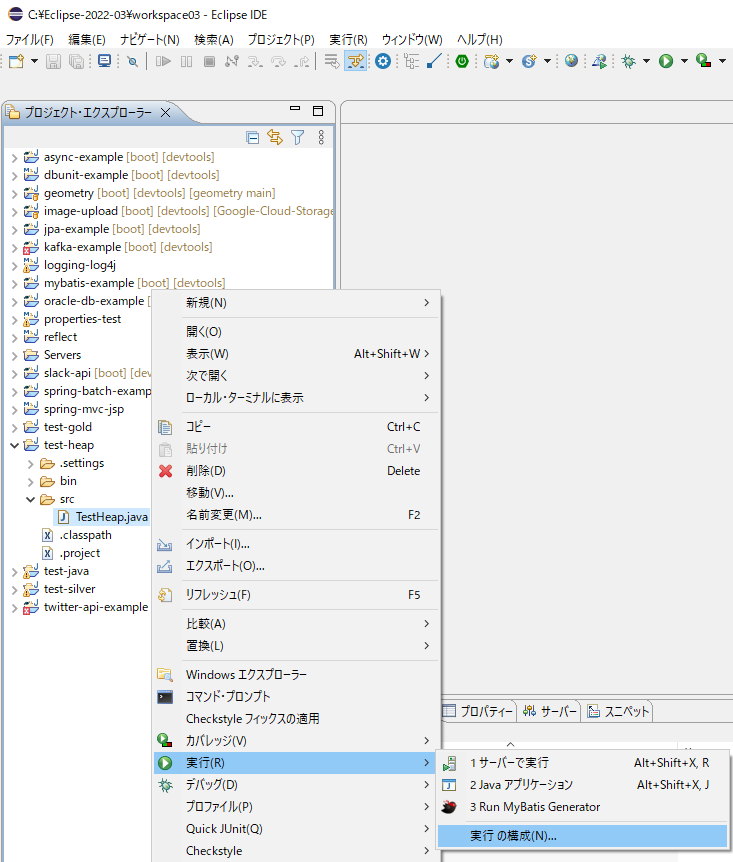
そしたらば、「実行」>「実行の構成」を選択。
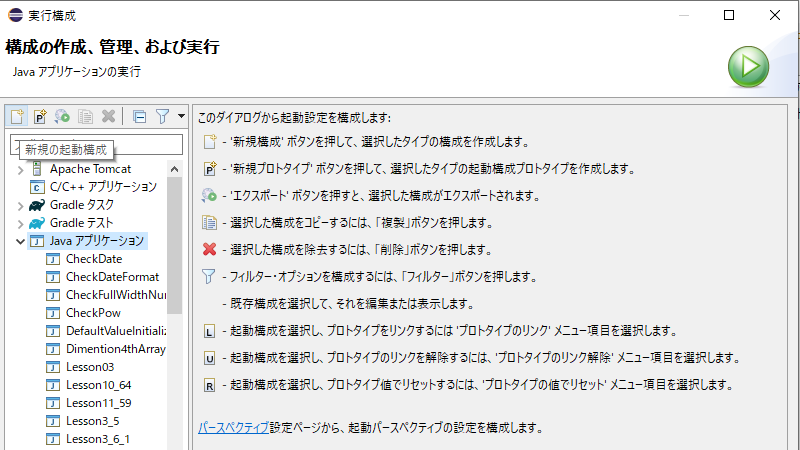
左サイドバーから「Javaアプリケーション」を選択した状態で、左上の「新規構成」ボタンのアイコンを押下。
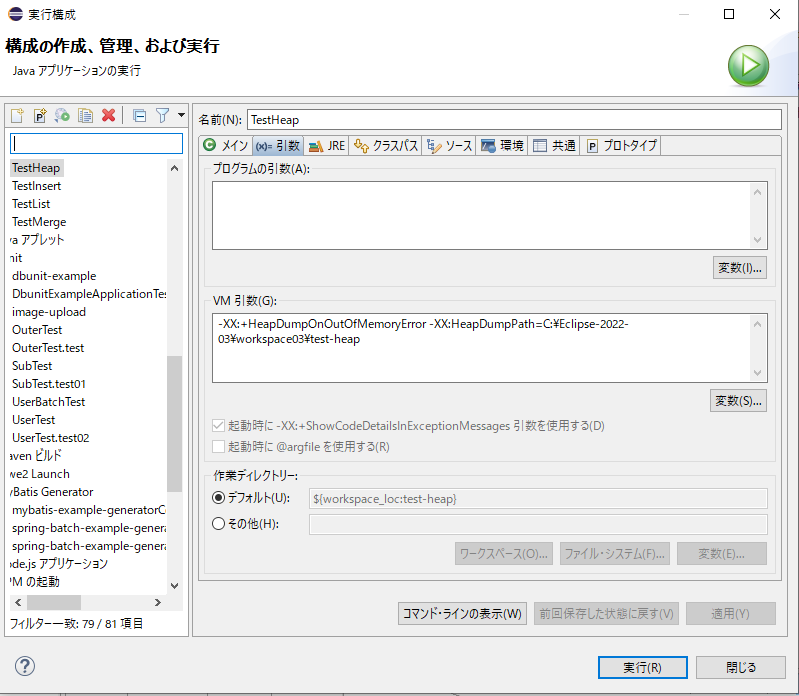
「引数」タブを選択し、「VM 引数(G):」のテキストエリアに、

「OOME(OutOfMemoryError)」が起きた時の「heap dump」ファイルを取得するオプションを追記。
で、実行すると、
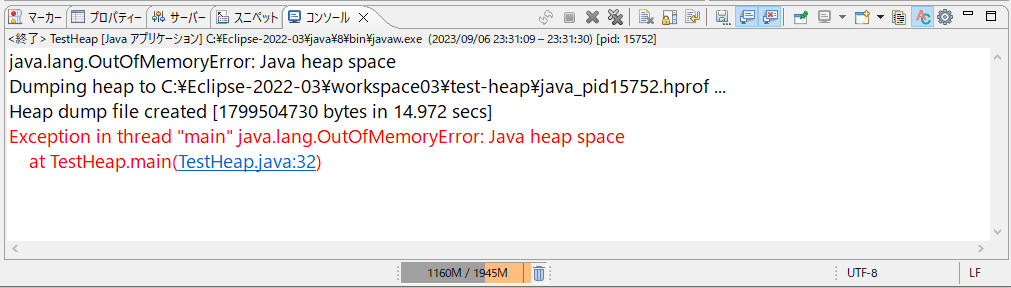
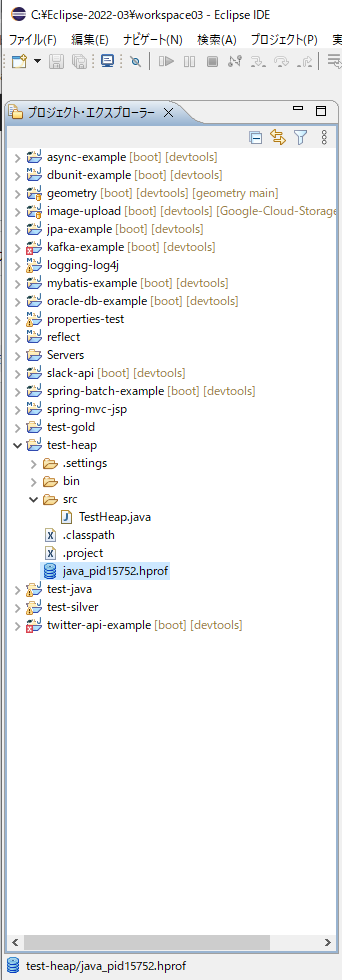
⇧「heap dump」ファイルが出力されている。
⇧ 前回、インストールした「Eclipse Memory Analizer」で、「heap dump」ファイルを解析してみる。

結果、
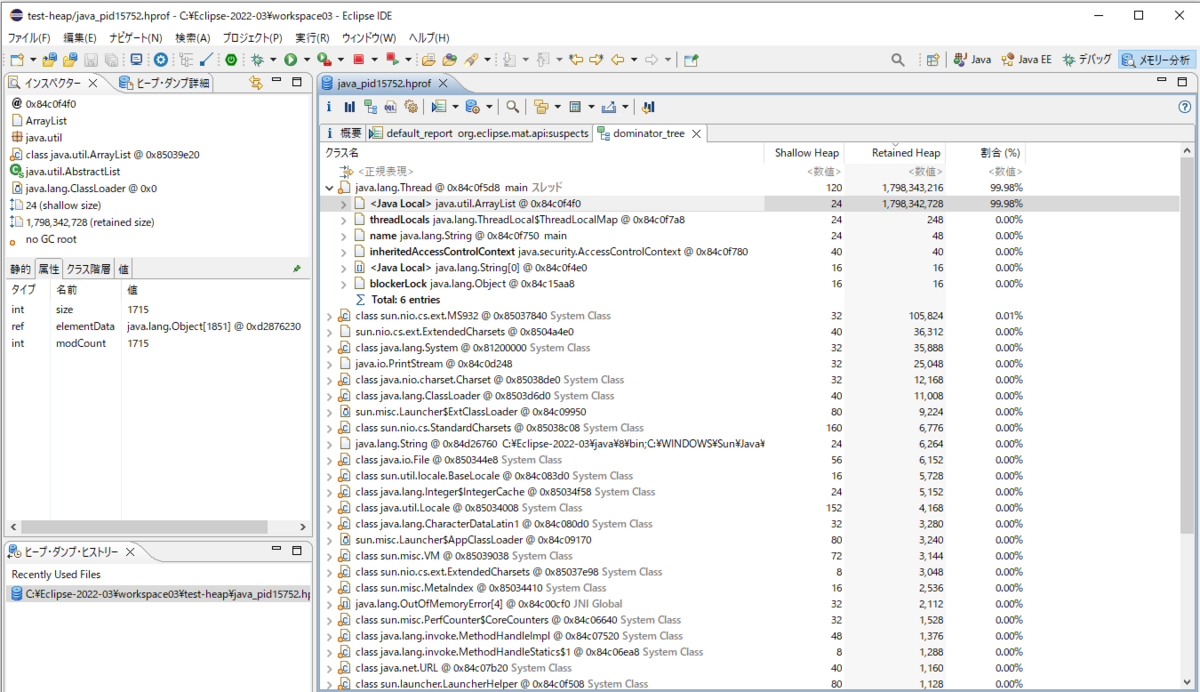
⇧ java.util.ArrayListが大量のメモリーを消費してそうなことは分かるのだけど、「スレッド・スタック」に出力されてる該当行を確認して、メモリーの使用率の高い処理の当たりを付ける感じになるんだろうか...

「Eclipse Memory Analizer」が微妙なのか、「heap dump」が微妙なのか、何かあんまり情報が得られないような...
ただのArrayListであろうと、データ量が膨大な場合はArrayListのオブジェクトのサイズが肥大することでメモリーを枯渇させるということですな。
処理内容によっては、コーディングの工夫でどうにもならない時があるあるだと思うけども、そんな時は「Java 仮想マシン(JVM:Java Virtual Machine)」のメモリのサイズの上限を上げたり、マシンのメモリをスケールアップしていくしかない感じですかね。
毎度モヤモヤ感が半端ない...
今回はこのへんで。